I am Abdul Rehman, experienced data analyst and business intelligence professional with over 11 years of expertise in transforming complex data into actionable insights. Adept at leveraging analytical tools to drive informed decision-making and optimize strategies. Passionate about uncovering patterns and trends that enhance organizational efficiency. Ready to tackle new challenges in the world of data.
Exploring RATIO_TO_REPORT
In the realm of database management and data analysis, Oracle has proven to be a reliable and powerful player. One of its lesser-known yet incredibly useful features is the analytical function RATIO_TO_REPORT. This function empowers data professionals to gain valuable insights into their datasets by providing a straightforward way to calculate the ratio of a selected value to the total of a specific set. In this blog, we'll dive deep into the RATIO_TO_REPORT function, understand its mechanics, and explore real-world examples to demonstrate its prowess.
Understanding the RATIO_TO_REPORT Function:
The RATIO_TO_REPORT function is part of Oracle's arsenal of analytical functions, which are specifically designed to operate within result sets produced by SQL queries. RATIO_TO_REPORT calculates the ratio of a given value to the total of a specified set. This ratio is expressed as a decimal, representing the portion of the value in relation to the entire set. The function is an excellent tool for performing percentage-based analyses, helping users uncover proportional insights within their data.
Syntax:
RATIO_TO_REPORT(expression) OVER (PARTITION BY partition_expression ORDER BY order_expression)
expression: The column or expression for which you want to calculate the ratioPARTITION BY: Optional clause to partition the data for separate calculationsORDER BY: Optional clause to specify the order of rows within the partition
Examples:
1. Basic Usage: Suppose we have a sales table with columns region, sales_amount, and sales_date. We want to find the ratio of sales for each region to the total sales.
SELECT
    region,
    sales_amount,
    RATIO_TO_REPORT(sales_amount) OVER () AS sales_ratio
FROM
    sales_table;
2. Partitioned Calculation: Now, let's say we want to calculate the sales ratio within each region separately.
SELECT
    region,
    sales_amount,
    RATIO_TO_REPORT(sales_amount) OVER (PARTITION BY region) AS region_sales_ratio
FROM
    sales_table;
3. Using ORDER BY: In the scenario where we need to order the data within each partition before performing the calculation:
SELECT
    region,
    sales_amount,
    RATIO_TO_REPORT(sales_amount) OVER (PARTITION BY region ORDER BY sales_date) AS ordered_sales_ratio
FROM
    sales_table;
4. Combining with Other Functions: We can leverage RATIO_TO_REPORT it in combination with other analytical functions. For instance, calculating the cumulative sales ratio alongside the cumulative sum of sales:
SELECT
    region,
    sales_amount,
    RATIO_TO_REPORT(sales_amount) OVER (PARTITION BY region ORDER BY sales_date) AS cumulative_sales_ratio,
    SUM(sales_amount) OVER (PARTITION BY region ORDER BY sales_date) AS cumulative_sales
FROM
    sales_table;
Use cases:
Calculating the percentage contribution of a value within a group. This can be useful for budgeting, sales analytics, etc.
Identifying outliers by comparing a value's ratio to the average ratio.
Distributing a total amount (budget, quota, etc.) according to the calculated ratios.
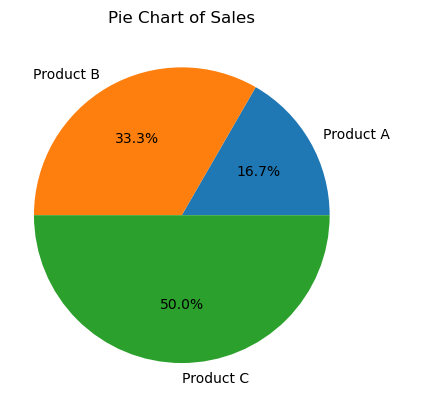
Let's have this data and achieve the same results differently for a better understanding.
Product Name | Sales | Ratio |
Product A | 100 | 0.2 |
Product B | 200 | 0.3 |
Product C | 300 | 0.5 |
Total | 600 |
|
Mathematically:
100/600 = 0.2
Python:
import pandas as pd
import matplotlib.pyplot as plt

# Create a dataframe
df = pd.DataFrame({'product_name': ['Product A', 'Product B', 'Product C'], 'sales': [100, 200, 300]})

# Calculate the ratio of sales to report
df['ratio_to_report'] = df['sales'] / df['sales'].sum()

# Create a pie chart of the ratio_to_report column
plt.pie(df['ratio_to_report'], labels=df['product_name'], autopct="%1.1f%%")
plt.title("Pie Chart of Sales")
plt.show()
DAX:
Sales[ratio_to_report] = DIVIDE(Sales[sales], SUM(Sales[sales]))
Conclusion:
The RATIO_TO_REPORT analytical function is a valuable addition to the toolkit of data analysts and database administrators. Its ability to compute ratios based on a selected value in relation to a set's total opens the door to a plethora of insightful data analyses. From simple percentage calculations to intricate partitioned analyses, the RATIO_TO_REPORT function empowers users to derive meaningful conclusions from their data. So, next time you're working with Oracle databases, remember to harness the power of RATIO_TO_REPORT proportion-based insights that can drive informed decision-making.